How To
Guide for First-Time Users
The core functionality of this website is on each of the individual state pages, where you can get both broad overviews and highly detailed information about park access and demographics.
Before you get started, make sure you create an account and log in. That will give you access to the state pages.
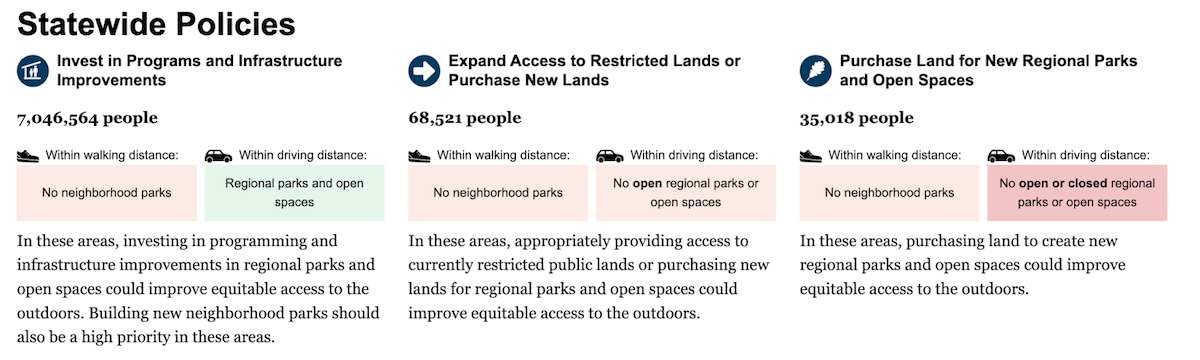
First, navigate to a state you’re interested in. Let’s say Georgia. Here, you’ll see a statewide overview of how many people fit into three statewide policies:
Below that, you’ll see some filter options (which we’ll come back to), and then a map of the state and a series of access and demographic readouts for the whole state below the map.
The default view of the map and demographics can give you an overall sense of the state. On the map, we show both public lands, colored by access stated (open or closed), and demographic points, colored by a user-selectable list of all our access and demographic variables. By default, we color the population data on the map by level of regional access, and you can change that selection, as described below.
The default view itself provides useful insights. For example, in Georgia access to regional parks and open spaces is reasonably high, but access to neighborhood parks is quite poor:
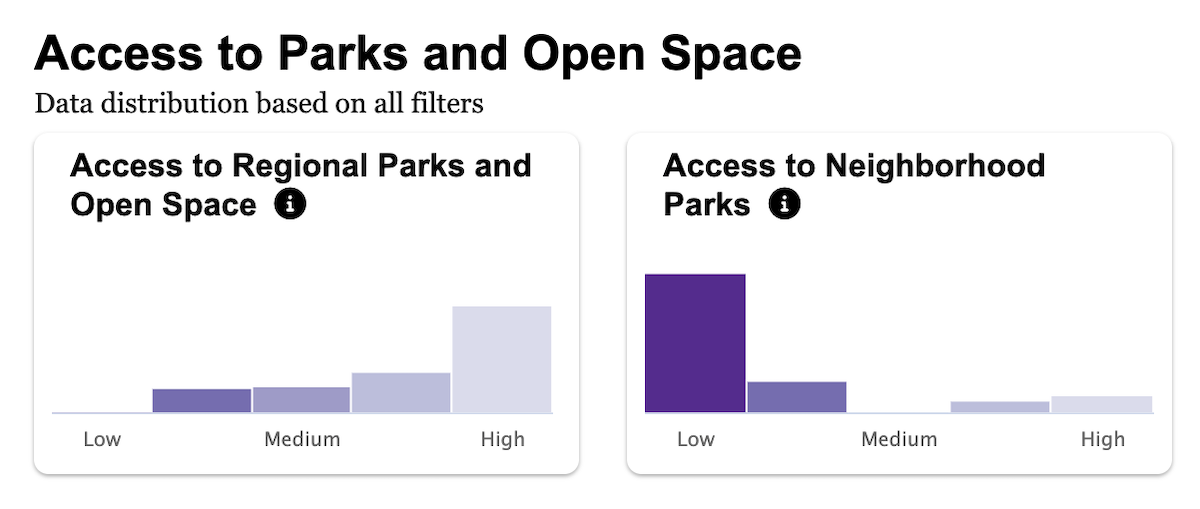
For more about how we define terms such as regional and neighborhood park, you can select the information icons on each chart item, or see our Methodology and Glossary section.
Once you have an overall sense of the state, you can drill down in a few ways:
Filter the map and demographics to include only people eligible for one of the three overarching policy recommendations.
Select sub-state areas, such as a specific city, county, legislative district, or park visitorshed to filter for just people in that area.
Change how the map is symbolized to see where communities with specific access or demographic characteristics might be concentrated.
All three of the above methods can be used separately or together, depending on what you are trying to learn. Each filter also creates a special link to that configuration, so you can save that link in your notes or share it with others.
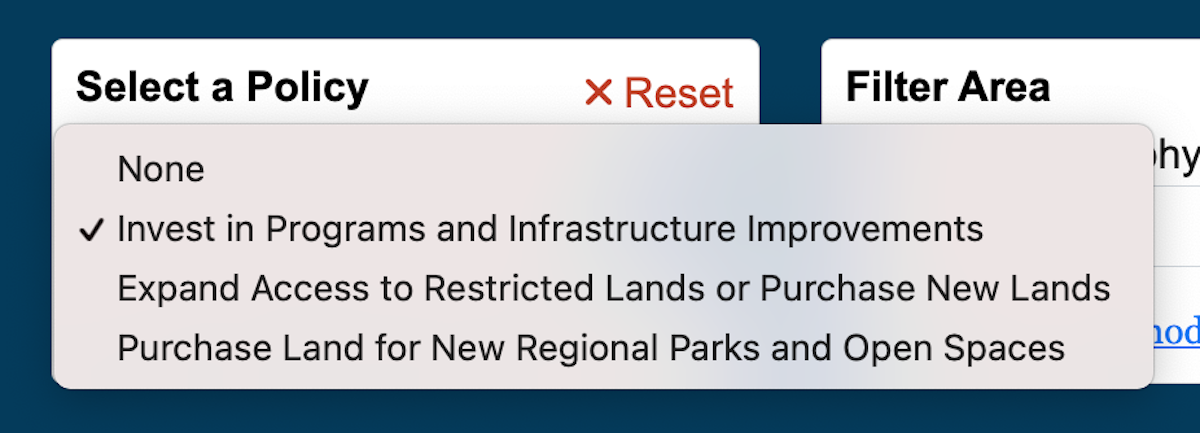
For example, if I want to see where Georgia should invest in programs and infrastructure to make existing regional parks more accessible, I’d use the “Select a policy” menu to restrict my map and demographics outputs to only the “Invest in Programs and Infrastructure Improvements” policy, as shown below. Here’s a link with that filter in place.
This shows me the roughly 7 million people in Georgia who live within easy driving distance of a regional park but have no neighborhood park within walking distance. Scanning the demographics below the map, I can see how these communities compare to the state as a whole along income, race, education, and other demographic lines. (They are pretty similar in this case.)
Next I could either use the Reset option on that filter to clear it, or I could add a Filter Area on top of that. Let’s see how the program investment policy plays out in Atlanta.
Here, we see that there are about 64,000 people within the Atlanta city limits who lack a park within walking distance but have one within driving distance. Given Atlanta’s large population and urban character, it is perhaps not surprising that we see about twice the statewide rate of limited car access in Atlanta (13%) that we do in the state as a whole (6%).
Here, we can use the additional tool of changing the map symbolization to see where we’d find those 8,000 people with no park within walking distance and limited car access. Here’s a link to that map.
This area at the city’s southern edge jumps out as worthy of a closer look:
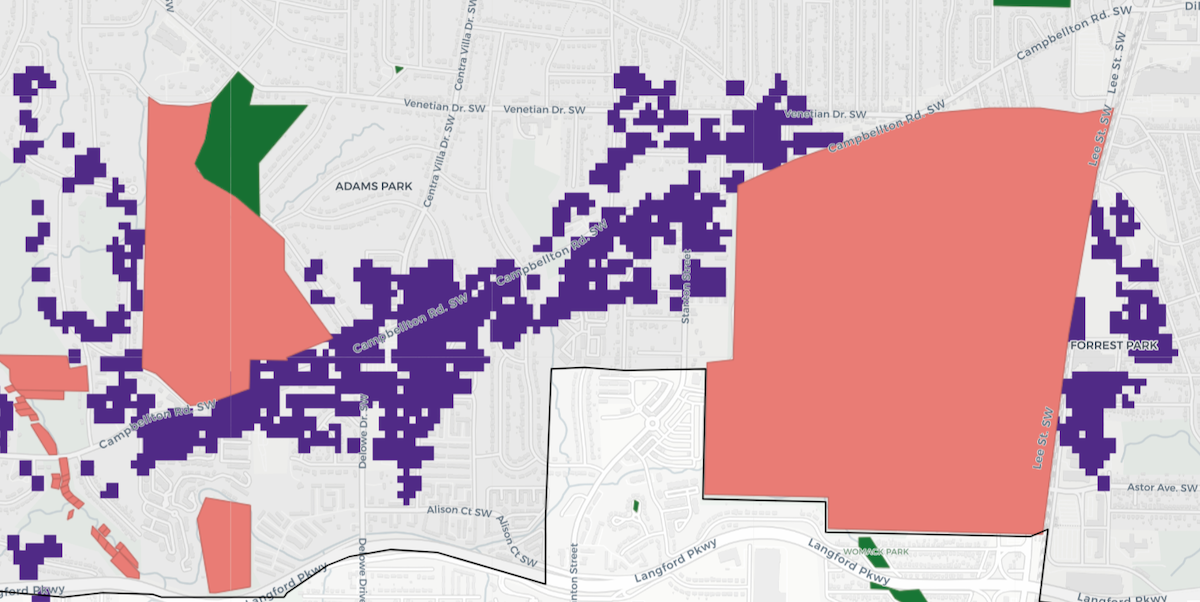
The red areas are restricted access public lands, while the purple squares represent people who lack access to vehicles. Here, we can use the Visitorshed tool to see what those two shapes are and who might benefit if they were made accessible.
To do that, under the Filter Area box, where we previously selected City, choose Visitorshed instead. Then, click the map inside one or the other of these shapes to see what it is, and then if you want to calculate the demographics of everyone who could easily access them, click Apply.
Here is that scenario for the shape on the right, Fort McPherson:
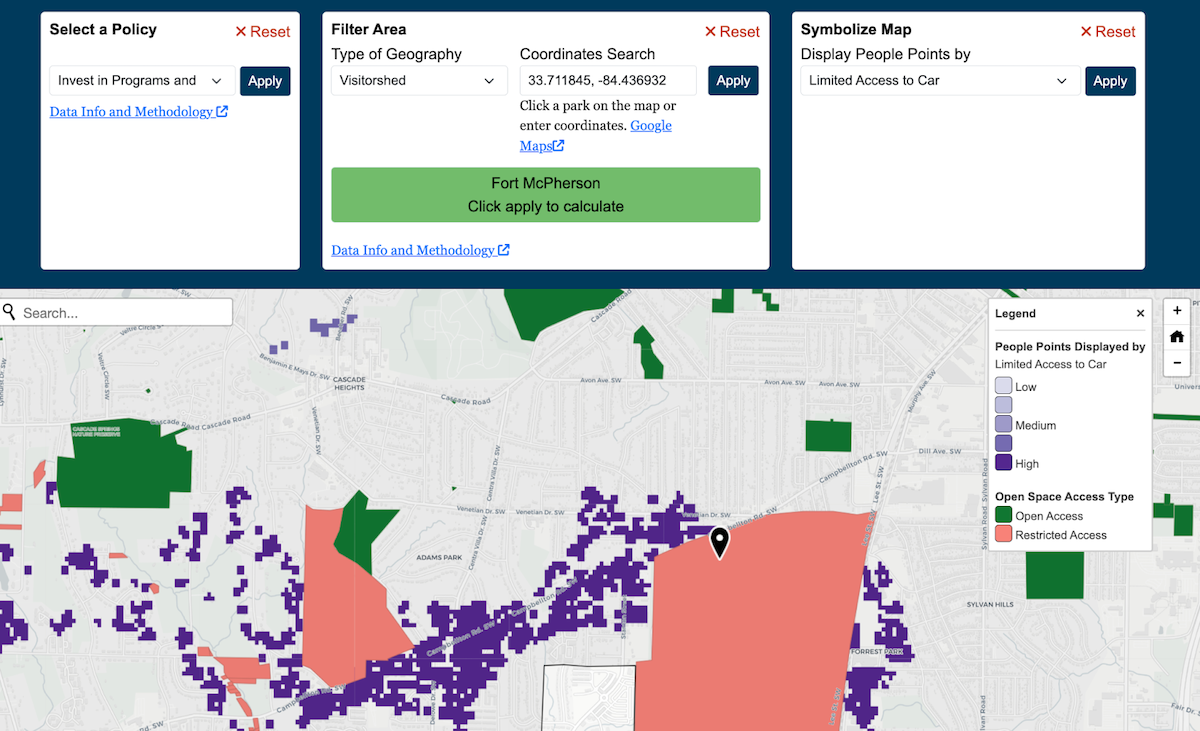
Here’s a link to that view, where we see that more than 200,000 people who lack a park within walking distance would benefit from access to Fort McPherson. According to the organization charged with developing the base, a new master plan as of 2021 will include at least some public access. The ParkAccess.org data and tool would support that as a key need of the community surrounding the base, though only people with direct, local knowledge can take the next step in how best to use this information to support equitable access to the outdoors.
As you can see, this website can provide both discovery opportunities (where are the people without access who need it?) as well as support of existing initiatives (can this tool support community needs for park access around Fort MacPherson?).
Learn More About How to Use Our Visitorsheds
One of the more powerful features on ParkAccess.org is the ability to analyze, in detail, the “visitorshed” of any public land in our database. They provide detailed demographic information about all the people we estimate would be likely to visit a particular park on a regular basis, at least as far as physical proximity is concerned.
For larger regional parks (more than 100 acres in a contiguous cluster of public lands), we define visitorsheds based on driving distances determined by the National Travel Survey for typical recreational trips. For parks under 100 acres, we use a half-mile buffer for walking distance. You can read more details about our methods on the About page.
As described in the Methods and Glossary, these measures are based on physical access to open space, using public land agency classifications for where access is allowed, national survey data to define typical driving distances for recreational trips, and half-mile walking distances. There’s much more to making access truly equitable than just physical proximity, but proximity is a necessary first step. The additional demographic data we provide can help guide public agencies, community organizations, and others in understanding what other barriers to access might exist, such as income, car access, or languages spoken.
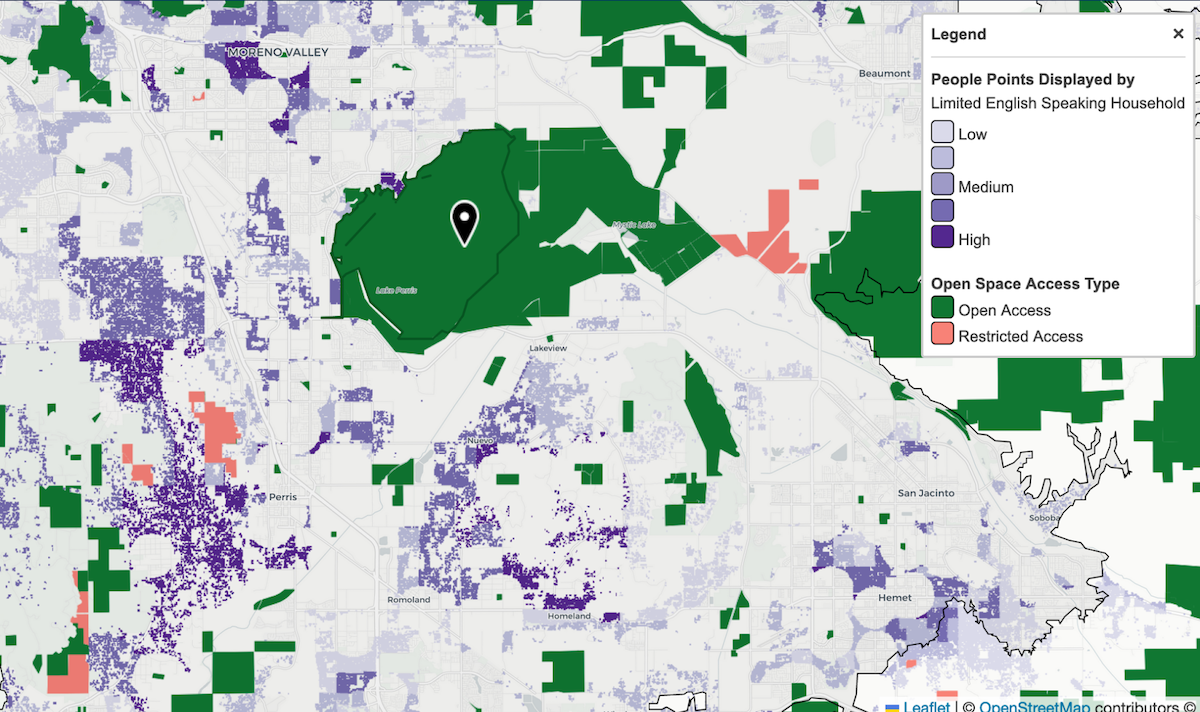
To take a specific example, Lake Perris State Recreation Area in Southern California has more than 500,000 people in its visitorhsed who lack access to neighborhood parks within walking distance. You can see that map here.
Overall, 6% of the people in that visitorshed live in limited English speaking households, which is less than the state average of 9%. But that doesn’t necessarily mean inclusive language-appropriate programming should not be a priority here. If we symbolize the map by that demographic attribute, we can see that those approximately 30,000 people live in a few concentrated areas around Moreno Valley ot the north and around Perris and unincorporated Mead Valley to the west:
We can also switch the map symbolization to HIspanic/Latino to see that those same areas are highlighted, among others in this view:
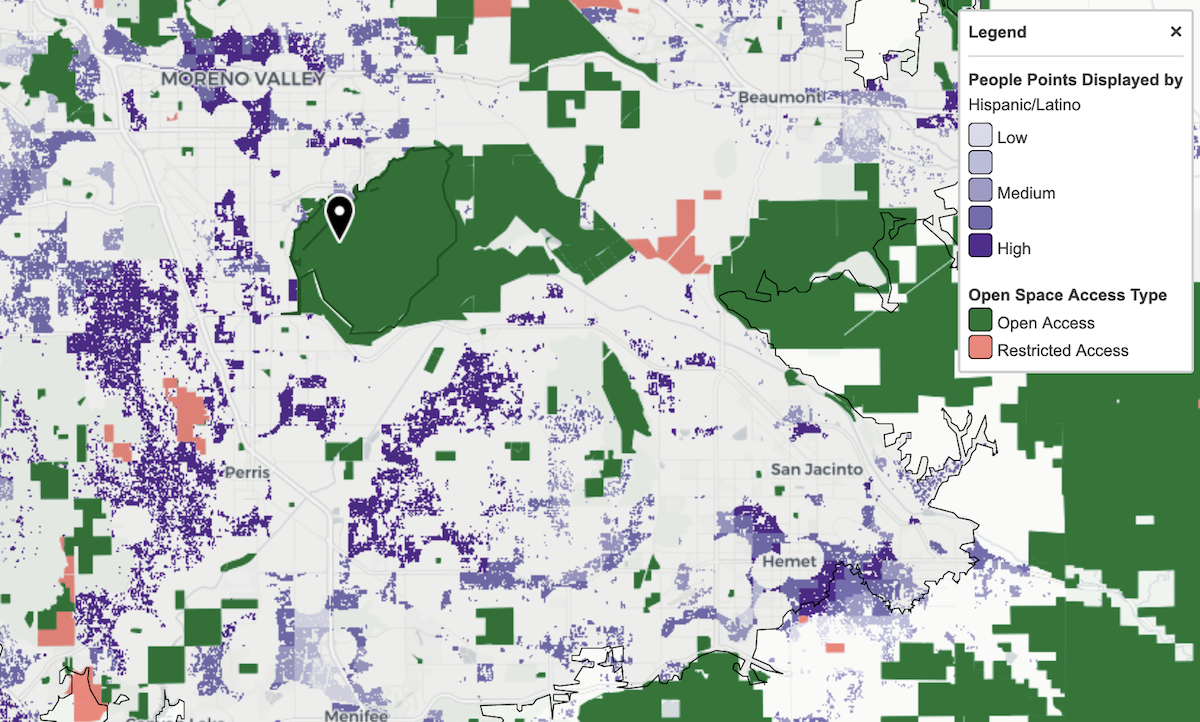
This brief inspection of a single visitorshed shows the potential depth and insight you can get by combining visitorshed selection with our detailed demographic data.